Water infrastructure backlog and access to water infrastructure delivered
Introduction
The United Nations Sustainable Development Goals (SDGs 6.1) targets the attainment of universal access to safe and affordable drinking water by 2030 [1]. In South Africa, access to sufficient water is a right accorded to all citizens and entails a constitutional obligation on government.
In order to meet target 6.1 of the SDGs and fulfil its constitutional obligation, government is required to make appropriate investments in water infrastructure delivery. In addition, the provision of water infrastructure has positive ripple effects for public health and the economy.
This brief/review provides an assessment of the state of the national water infrastructure backlog and access to water infrastructure as viewed within global development principles and aspirations.
Sources of drinking water in South Africa
Provision of safe and affordable water remains a priority in South Africa but its realisation remains precarious. The country is committed to a policy of free basic water, aimed at furnishing all poor households with a basic water supply (25 litres per capita per day) at no cost to the household [2].
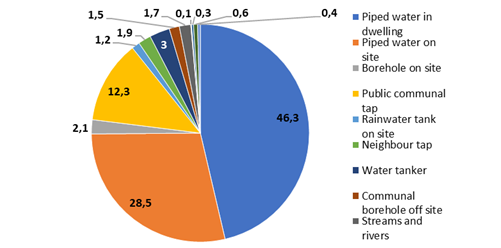
Despite these commitments, access to water infrastructure provision remains an elusive dream for many households. For instance, the 2018 General Household Survey (GHS) [3] indicated that in 2018 thousands of South African households still depend on unimproved and unprotected sources of drinking water. These include dams and pools, rivers and streams and springs (Figure 1). Drinking contaminated water exposes the consumer to waterborne disease-causing organisms like bacteria, viruses, parasites and an array of other contaminants like heavy metals, pesticides, fertilizers, and human and animal waste.

Figure 1: Distribution of households by source of drinking water
General Household Survey2018
The absence of water infrastructure has direct health implications. The World Health Organization [4] estimates that, globally, ingestion of contaminated water is responsible for 485 000 diarrhoeal deaths each year. And diarrhoea-related mortality accounts for approximately 20% of deaths among South African children under-five [5].
In addition, absence of appropriate water infrastructure compels thousands of households (mainly women and children) [6] to travel long distances to access drinking water [6]. This has multiple detrimental effects on their wellbeing such as;
· Physical water-carrying may produce musculoskeletal disorders and related disabilities [7].
· Women around the world spend collective 200 million hours a day collecting water [8]. Time spent fetching water and fuel reduces the time that can be devoted to generating livelihoods or in remunerated work [9].
Water infrastructure backlog
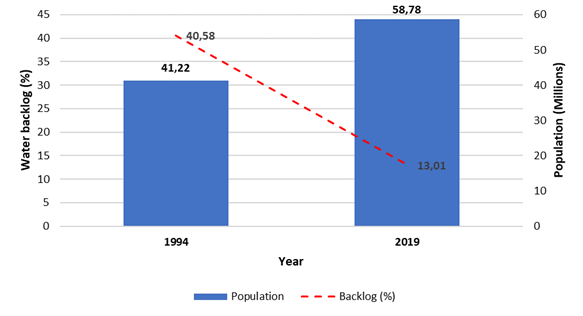
Since democratic constitutionalism in 1994, the country has achieved improvements in the provision of water infrastructure. The result has been reduction of the water infrastructure backlog by 27.57% (based on population as a unit of measure) over the past 25 years (Figure 2). The current national water infrastructure backlog is 13.01% (Figure.2).

Figure 2: Water infrastructure backlog and Population between 1994 and 2019
Water Services Knowledge System
One of the major challenges for infrastructure provision is population growth. Countries like South Africa have little choice but to consider innovative approaches to ensure that they eliminate their water infrastructure backlogs (Ruiters [10]). For South Africa to overcome the current national water infrastructure backlog, it is imperative that infrastructure investment and delivery outpace current and projected national population growth. This raises the question whether the economy is strong enough to sustain national infrastructure demands and necessary delivery.
The 2019 water infrastructure backlog data
The distribution of the water infrastructure backlog (with households as the unit of observation) across Water Service Authorities is shown in the Appendix. The distribution is highly skewed. While the median value of the backlog is below 5%, 10% of water services authorities have backlogs above 25%.
Further analysis reveals major provincial water backlog variability. For instance, highly urbanised provinces such as Gauteng (GP) and the Western Cape (WC) have over the past 25 years managed to reduce the water infrastructure backlog to less than 2% of the population. Despite major overall national improvement, water backlog remains relatively high in predominantly rural provinces. These include Eastern Cape (EC), KwaZulu-Natal (KZN), Limpopo (LP), Mpumalanga (MP) and the North West (NW) (Table 1).
Table 1: Inherited and recently achieved water infrastructure backlog - population
|
Province |
1994 Pop Backlog % |
2019 Pop Backlog % |
Population Backlog Reduction |
|
EC |
61,55 |
31,23 |
30,32 |
|
FS |
24,00 |
2,78 |
21,22 |
|
GT |
17,18 |
1,62 |
15,56 |
|
KZ |
46,51 |
20,19 |
26,32 |
|
LP |
51,96 |
25,80 |
26,16 |
|
MP |
42,39 |
14,71 |
27,68 |
|
NW |
40,08 |
16,57 |
23,51 |
|
NC |
39,03 |
6,43 |
32,6 |
|
WC |
38,48 |
0,73 |
37,75 |
|
RSA |
40,58 |
13,01 |
27,57 |
Access to water infrastructure delivery
Access to water infrastructure is defined as the provision of tapped water. This could be through a communal stand pipe located within 200m a dwelling, water in the yard or water inside a dwelling. The concept entails physical availability of the infrastructure without consideration of the quality or the reliability of the service.
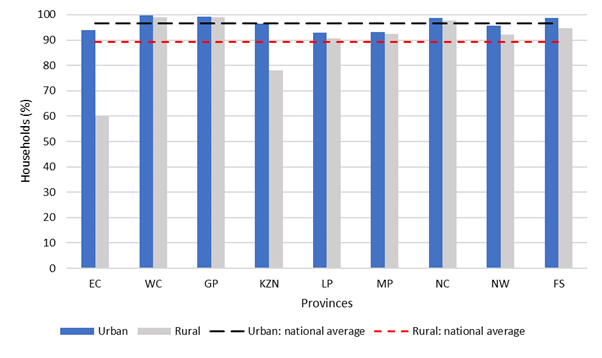
Similar to water infrastructure backlog, access to water infrastructure delivery is highly unequal per province. The April 2019 water infrastructure data indicate significant provincial infrastructure delivery disparities. Thus, infrastructure provision for rural provinces like of EC, KZN, LP, MP and NW is observed to be lower than that of highly urbanised provinces like GP and WC provinces (Figure 3).

Figure 3: State of access to water infrastructure delivery per province
In addition to provincial disparities in infrastructure delivery, the data reveal a further dimension. This is socio-economic or spatial inequality. Access to water infrastructure provision across provinces is markedly lower in rural areas than in urban areas.
A rural area is an area that is not classified as urban. Rural areas may comprise one or more of the following: tribal (or traditional or communal) areas, commercial farms and informal settlements [11].
Agenda 2030 on Sustainable Development, adopted by UN member states in September 2015. At its core is the ‘Leave No One Behind’ (LNOB) principle. The principle entails that those who are worst off should be reached first [12]. For South Africa to conform to this principle, it is imperative that water infrastructure investment should prioritise provinces with high water backlogs, low access to water infrastructure delivery and rural areas in particular.
The LNOB principle and concomitant commitment to it would ensure a more equitable investment in water infrastructure investment and delivery by 2030. Conversely, failure to embrace the principle will only widen present disparities and lead to greater inequality.
Conclusions and recommendations
Since 1994, South Africa has achieved major reductions in water backlog with consequent improvement in access to water infrastructure delivery. However, a rural-urban divide persists. Water infrastructure delivery also varies across provinces. This is out of line with global development principles.
National water infrastructure delivery inequalities subject vulnerable individuals and communities to unimproved and contaminated sources of drinking water. It is therefore necessary that national water infrastructure investments and policies be directed towards prioritising rural provinces and areas to avoid geospatial disparities in infrastructure delivery.
Appendix: Water Infrastructure backlog by Water Service Authority
Box and whisker plot
Percentage of households in backlog

The thick line in the box-plot represents the 3.9 median value (50th percentile of the distribution). The box contains observations between the 25th and the 75th percentile and the whiskers (lines) above and below the box, indicate the 90th and 10th percentiles. The circles above the 90th percentile whisker represent conditions in the outliers.
Source: Regional data for households (April 2019)
Nhlanhla Mnisi
Researcher
nhlanhla@hsf.org.za
References
1. United Nations (2018) Sustainable Development Goal 6 Synthesis Report on Water and Sanitation, page 11, URL: https://sustainabledevelopment.un.org/content/documents/19901SDG6_SR2018_web_3.pdf).
2. African Ministers’ Council of water (AMCOW). https://www.wsp.org/sites/wsp/files/publications/CSO-SouthAfrica.pdf)
3. Statistics South Africa (2019). STATISTICAL RELEASE P0318 General Household Survey 2018.
4. World Health Organization (2019) https://www.who.int/news-room/fact-sheets/detail/drinking-water).
5. Chola L. Michalow, J. Tugendaft A., Hofman, K. (2015). Reducing diarrhoea deaths in South Africa: costs and effects of scaling up essential interventions to prevent and treat diarrhoea in under five children. BMC Public health. 15: 394. 1-10.
6. UNESCO-IHE (2019). why is fetching water considered a ‘woman’s job’? https://www.un-ihe.org/stories/why-fetching-water-considered-%E2%80%98woman%E2%80%99s-job%E2%80%99.
7. L Geere, L., Hunter PR, Jagals, P. (2015). Domestic water carrying and its implications for health: a review and mixed methods pilot study in Limpopo Province, South Africa. Bio Med.
8. UNICEF (2016). Women, girls across the world spend 200mm hours daily collecting water. https://yourstory.com/2016/08/water-cisis-unicef.
9. Geere J.& Cortobius, M (2017). Who Carries the Weight of Water? Fetching Water in Rural and Urban Areas and the Implications for Water Security. Water Alternatives. 512-540.
10. Ruiters, C. (2013). Funding models for financing water infrastructure in South Africa: Framework and critical analysis of alternatives. Water SA. Water SA Vol. 39 No. 2. http://dx.doi.org/10.4314/wsa.v39i2.16
11. Statistics South Africa (2013). Statistical release: Mid-year population estimates. Report number: P0302.
12. UN (2019). Leaving no one behind: AUNSDG operational guide for UN country Teams. https://undg.org/wp-content/uploads/2019/04/Interim-Draft-Operational-Guide-on-LNOB-for-UNCTs.pdf.

