The Social Relief of Distress - How Well Did the Social Relief of Distress Grant Perform in January 2021?
Introduction
In April 2020, Jeremy Seekings and his co-authors[1] estimated that anywhere between 10 and 20 million people could be eligible for the Social Relief of Distress grant. Yet in the year of its operation to April 2021, an average of just under 5.7 million people received the grant each month. Was the Seekings et al estimate too high? Conversely, has the take up of the grant been low? And how well has the grant been targeted?
The fourth wave of the National Income Dynamics Study Coronavirus Rapid Mobile Survey collected data for the month of January 2021, including information on applications for the SRD grant and receipts of it. This brief considers information from it, along with data from the Quarterly Labour Force Survey for the first quarter of 2021, in an attempt to answer these questions.
The surveys
The NIDS-CRAM survey has two important limitations. The first is that its respondents have been selected from the NIDS Wave 5 survey in 2017 (with top ups), so it does not include additions to the population through immigration since that date. The second is that NIDS-CRAM did not attempt to interview or collect information on everyone currently living with sampled individuals. This means that NIDS-CRAM data cannot be used to conduct household level analysis, though they can be used to estimate statistics at an individual level about household living conditions.
On the other hand, the QLFS collects information about all the individuals within a household, so household level analysis is possible, with one important caveat. At the design stage, the weights for all individuals within the household are equal, and equal to the household weight. But extensive post-survey recalibration of person weights to reproduce independently derived population estimates for various age, race and gender groups at national level and individual metropolitan and non-metropolitan area levels within the provinces and, more recently to correct for biases in interviews by telephone rather than by face-to-face interview, destroys the equality of personal weights within households, leaving household weights undefined, and the best one can do is to impute the household weight as the average of the personal weights. The QLFS also contains no information on the receipt of the social relief of distress grant.
The determination and estimation of eligibility
Annexure 1 of the first brief in this series shows that eligibility form the SRD grant is universal for people age 18 and above, unless one or more disqualifying conditions are triggered. What SASSA does is to run each application for SRD grants through the specified data bases specified, including bank accounts, using the permission granted for this by the applicant as a condition for the consideration of the application.
Assuming that the data bases are completely accurate (which they are not), the following problems arise:
- Nothing on any of the databases specified enables SASSA to distinguish whether a person who is not employed is unemployed, a discouraged worker or not economically active. So the requirement that a person is unemployed effectively means that he or she is not employed. Whether a distinction between the unemployed/discouraged workers and the not economically active should be made will be considered below.
- Moreover, SASSA cannot even identify all employed people. It can pick up whether an applicant is a public servant and so appears on the PERSAL system, and it can pick up income from employment if it goes through a bank account or shows up in UIF contributions. But payment of wages in cash are invisible to it.
- People who receive any income are disqualified. ‘Income’ is not defined in the Directive establishing the SRD grant. The usual definition of income is an addition to net wealth. Some bank deposits are not income in this sense. For instance, taking out a loan is not an addition to net wealth, since the asset (cash at bank) is matched by a liability (debt). Distinguishing deposits which are income from those that are not is no easy task. If SASSA is taking evidence of any bank deposit as proof of income, it will disqualify some applicants who should not be disqualified. On the other hand, cash receipts which are income cannot be detected by SASSA.
When eligibility is assessed using information from the surveys, a further problem is inaccurate recording of employment or receipt of social grants.
In short, we are on marshy ground and inferences from the available data must be made with particular care.
Sample size and demographics
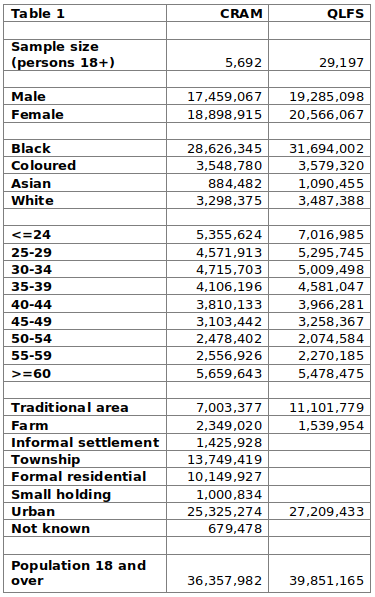
Table 1 sets out sample sizes, and presents estimates of the population age 18 and over by gender, population, age group and settlement type.
It shows that:
- The sample size is much bigger than in the QLFS than in the CRAM, making for more precise estimates in the former, and this remains true when differences in sample design are taken into account.
- The CRAM estimate of the total population age 18 and over is lower than the QLFS estimate, as one would expect, since the CRAM estimate omits people who have immigrated between 2017 and early 2021.
- Relative to the QLFS, the CRAM sample is biased away from the 18-24 age group, away from traditional areas and towards farms. The first bias arises because 18 year olds are under-represented in the CRAM sample because of the way is constructed. Why the CRAM sample is biased way from traditional areas and towards farms is not known.
Labour market status
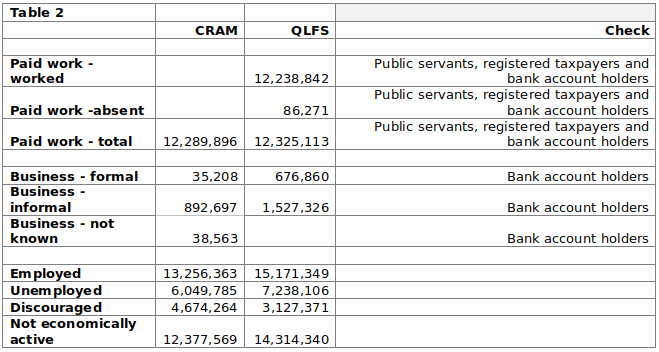
Table 2 sets out labour market status from the surveys. The principal differences between the surveys are that the CRAM survey finds markedly fewer people in both formal and informal business and markedly more discouraged workers than the QLFS.
State payments
Table 3 sets out state payments from the surveys and from SASSA statistics. Information on UIF payments are incomplete, while the CRAM survey captures markedly fewer social grant payments than the QLFS.
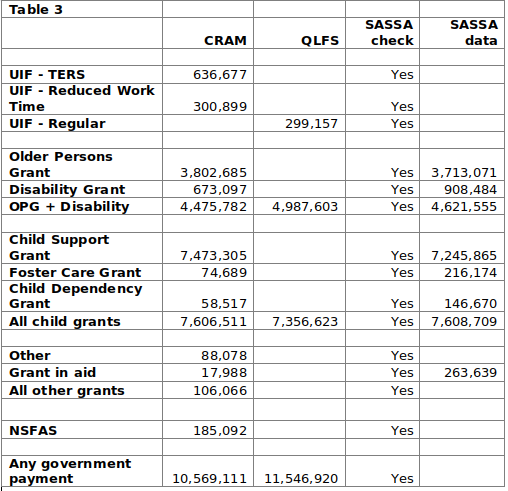
In order to bring the number of child grants in both the GHS and the NIDS-CRAM data up to approximately the grants made by SASSA, additional recipient caregivers were identified in both data sets and child support grants were imputed to them.
Eligibility for the SRD grant
Table 4 shows the numbers disqualified, on one ground or another, for the SRD grant. The CRAM estimate is markedly lower than the QLFS estimate, mainly because business activity is less often recorded and because fewer government payments are recorded. The numbers who are qualified similar, though it must be borne in mind that recent immigrants are excluded from the CRASM sample. The NIDS estimate is to be preferred, because (a) there are no exclusions from the adult population (b) its business and grant data are more plausible and (c) the 95% confidence interval is narrower.
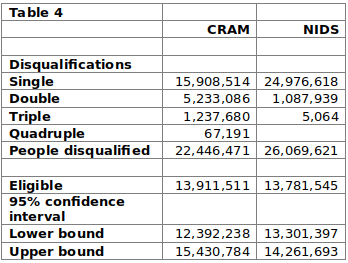
The number of eligible recipients is then estimated at 13.8 million, squarely within the Seekings et al range
Targeting: eligibility
When it comes to targeting, however, we have to rely on the CRAM data. Total SRD grants paid in January 2021 were 5 557 374, as estimated by NIDS-CRAM wave 4. This compares with 5 934 216, based on information given in Parliament (see Annexure 2 in the first brief). These estimates are consistent, given NIDS-CRAM sampling error.
Table 5 cross-tabulates SRD grant applications status by eligibility for the grant. It shows that there have been over two million applications which have been successful at some stage, even though the applicants were not eligible in January 2021. More than two million applications have been unsuccessful, even though the applicants were eligible in January 2021. And over six million people have never applied for the grant, even though they were eligible.
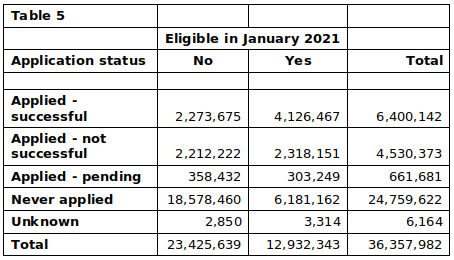
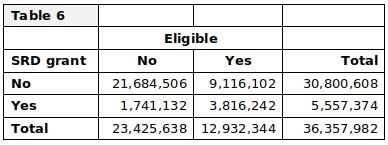
Table 6 cross-tabulates eligibility for the SRD grant against receipt of it in January 2021. It shows:
- 31% of the SRD grants paid were paid to people who were not eligible for them. The checking process is not complete and over a million and a half people were missed by it, three quarters of whom earned payment from employment.
- Of the eligible people, 30% received SRD grants.
The social relief of distress grant has had an on-off history. It was initially for the period from May to October 2020, then was extended twice by three months to April 2021. No SRD grant was payable from May to July 2021, but it has been reinstated from August 2021 to March 2022. Particularly if is further extended, the take up rate among the eligible may well rise.
Targeting: Who got the SRD grant in January 2021?
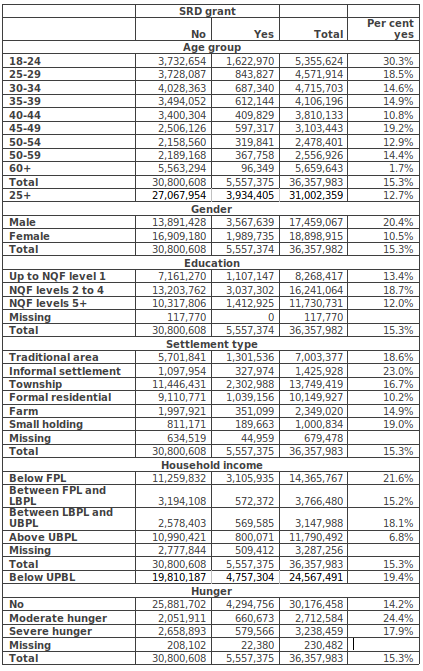
Annexure 1 tabulates who got the SRD grant and who did not by age group, gender, education, settlement type, household income and hunger in the seven days before the survey. The noticeable features of the tabulation are:
- Members of the youngest age group (18-24) were more than twice as likely as older adults to receive the grant.
- Men were twice as likely as women to receive it. What needs disentangling here is the extent that many women will have been disqualified from receiving the grant because they receive child grants. Very few men receive them.
- People in households with per capita income above the UBPL were just over a third as likely as those in households below the UPBL to receive it.
- People in households with moderate hunger were 1.7 times as likely as those in households reporting no hunger, but this ratio drops for those with severe hunger.
- There is no clear pattern when it comes to education and settlement type.
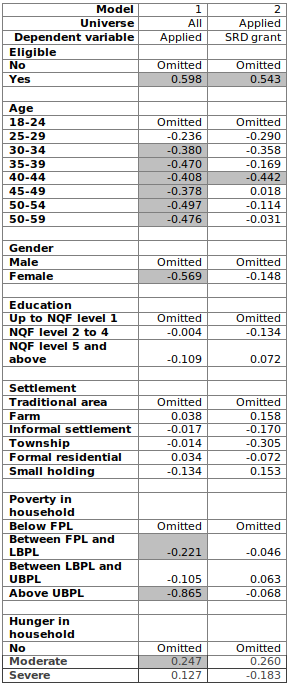
Annexure 2 reports the results of two probit models:
Model 1 considers the probability of an adult applying for the grant
Model 2 considers the probability of an adult receiving the grant, given application for it.
Consider Model 2 first. Given an application, the probability of receiving increase significantly with eligibility, but it does not depend on any other of the variables[2]. The other variables ought not to affect the probability, so in respect of them, this is as it should be. What is not as it should be is what Table 5 reveals: the applications which are accepted when they should have been rejected, and which are rejected, when they should have been accepted.
Model 1 then indicates that:
- the reason that the young are more likely to receive grants is that they are more likely to apply for them.
- when eligibility is taken into account, women are less likely than men to apply.
- application patterns by household income and hunger status correspond with SRD grant patters
- there are no significant variations in application rates by educational level and settlement type.
Conclusion
No doubt, the SRD grant has reduced hunger. The questions are: by how much, with what efficiency, and can legitimate demand for SRD grants increase well beyond the number of grants made in the first twelve months of experience with it? The analysis indicates that there are grounds for serious concern about the answers to all three questions.
Can the magnitude of the deterioration be checked? And what are the implications for hunger?
Charles Simkins
Head of Research
charles@hsf.org.za
Annexure 1
Annexure 2 – Probit results
Shaded areas show coefficients significantly different from zero at the 5% significance level
[1] Jeremy Seekings, Lena Gronbach and Nicoli Nattrass, Covid-19 grant: can we learn from Namibia? Daily Maverick, 29 April 2020
[2] Disregarding the 40-44 age group.

