August Production Estimates And April To June Quarterly Employment Statistics
Cross the river by feeling the stones.
- Deng Xiaoping
This brief is the ninth in series discussing developments in production, the labour market and macroeconomic policy since the beginning of 2020[1].
Introduction
The aim is to build up a picture of how the economy has performed and may perform in the short run future and to consider how policy, especially fiscal policy, might best respond to developments. In particular, it will be important to balance support for consumption and support for investment carefully. Keeping up to date in a fast moving environment is crucial. The economy is not now where it was in April. Obsolete narrative obscures rather than illuminates.
August production data
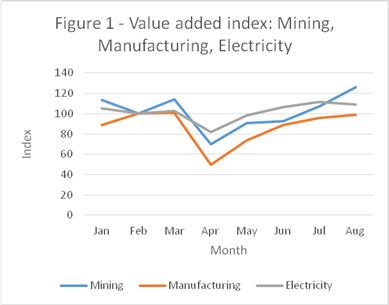
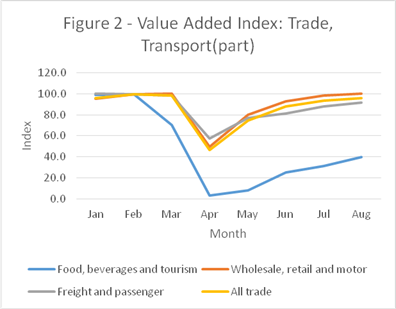
This brief is divided into two sections. The first adds August monthly production data to the analysis presented in Brief 5. The method of analysis is set out in that brief. Here, updated graphs are presented. Table 1 sets out value added indices for August (February=100).
Table 1
|
Sector |
August index |
|
Mining |
126.0 |
|
Manufacturing |
98.9 |
|
Electricity |
108.8 |
|
Trade: Food, beverages and tourism |
39.5 |
|
Trade: Wholesale, retail, motor |
100.4 |
|
Transport |
92.1 |
|
All sectors covered |
105.3 |


Table 1 indicates that the value added in the private sector (construction and finance and business services excluded) is, for all intents and purposes, back to where it was in February. The food, beverages and tourism is a clear laggard. By contrast, value added in the mining sector is markedly higher. Construction was badly hit in the second quarter, and we shall have to wait for the third quarter GDP estimates to be published in December to see the extent of improvement. As shown in Brief 5, value added in the finance and business services was little affected by the lockdown.
This is good news, and it suggests that further stimulation of demand (over and above the effects of already accommodative monetary policy and a very large fiscal deficit) should be approached with circumspection. There is more inflation risk in the South African economy than in a number of advanced countries and excessive monetary stimulation can cause an asset price bubble.
The Quarterly Employment Statistics: April to June
Unlike the Quarterly Labour Force Survey (“QLFS”), which surveys households, and the NIDS-CRAM Survey, which surveys individuals, the Quarterly Employment Statistics (“QES”) is an enterprise-based sample survey conducted by Statistics South Africa. The sample is drawn from private non-agricultural businesses, as well as from national, provincial and local government entities. There are approximately 20 000 VAT registered businesses in the sample. To be included in the sample, a business must have a turnover of at least R 300 000 per annum. Employment in private households is excluded.
Table 2 compares estimates of employment and earnings.
|
Q1 |
Q2 |
Change |
|
|
QES |
|||
|
Full-time employees |
10,196,000 |
9,548,000 |
-6.4% |
|
Part-time employees |
1,031,000 |
924,000 |
-10.4% |
|
All employees |
11,227,000 |
10,472,000 |
-6.7% |
|
Rand million |
|||
|
Gross earnings |
729,387 |
647,227 |
-11.3% |
|
Basic salary |
666,789 |
601,020 |
-9.9% |
|
Bonus and overtime |
62,598 |
46,207 |
-26.2% |
|
QLFS - formal sector excluding |
|||
|
agriculture and private households |
11,270,000 |
10,039,000 |
-10.9% |
|
National accounts |
|||
|
Rand million |
|||
|
Compensation of employees |
593,326 |
556,642 |
-6.2% |
|
Less agriculture |
8,385 |
8,683 |
|
|
Other sectors |
584,941 |
547,959 |
-6.3% |
Employment as measured by the QES fell by 6.4% between the end of March and the end of June. The NIDS-CRAM data indicate a sharper fall in April, followed by a partial recovery. The drop in part-time employment was greater than in full-time employment. Gross earnings fell by more than employment, partly because bonuses and overtime payments contracted sharply. Basic salary earnings also fell further than employment, indicating a modest degree of wage cutting among the employed as a whole, but sharper in its impact on the approximately one in five on whom it fell.
Comparative data from the QLFS and the national accounts are included in Table 2. The definitions of both ‘formal’ and ‘employed’ differ between the QES and QLFS and there is sampling error in both estimates. The reference period also differs: the QES reflects the position at the end of the quarter, whereas QLFS data are collected throughout the quarter. More puzzling is the discrepancy between compensation of employees as measured by the QES and the corresponding entries in the national accounts and, more particularly, the differences in changes between the first and second quarters.
Comparisons of this kind raise the question: Considering all sources of information together – the national accounts, monthly production statistics, the QLFS, the QES and NIDS-CRAM – how coherent and precise is the picture that emerges? This is not a straightforward question and discussion of the issues it raises is deferred to a later brief.
Charles Simkins
Head of Research
charles@hsf.org.za
[1] The eight preceding briefs are Charles Simkins, (1) Decision making in a time of uncertainty, 11 June, (2) The Adjustment Budget and beyond, 30 June, (3) Has the Supplementary Budget betrayed the promise of a R 500 billion stimulus package? 15 July, (4) Austerity and a permanent income shock, 15 July, (5) The implications of the second quarter Gross Domestic Product data, 11 September, (6) (with Charles Collocott) July production statistics: an indication of a V-shaped recovery? 28 September, (7) The April to June Quarterly Labour Force Survey: a cautionary note, 30 September, and (8) The National Income Dynamics Study’s Coronavirus Rapid Mobile Survey: the labour market in the first and second quarters of 2020, 14 October.

